

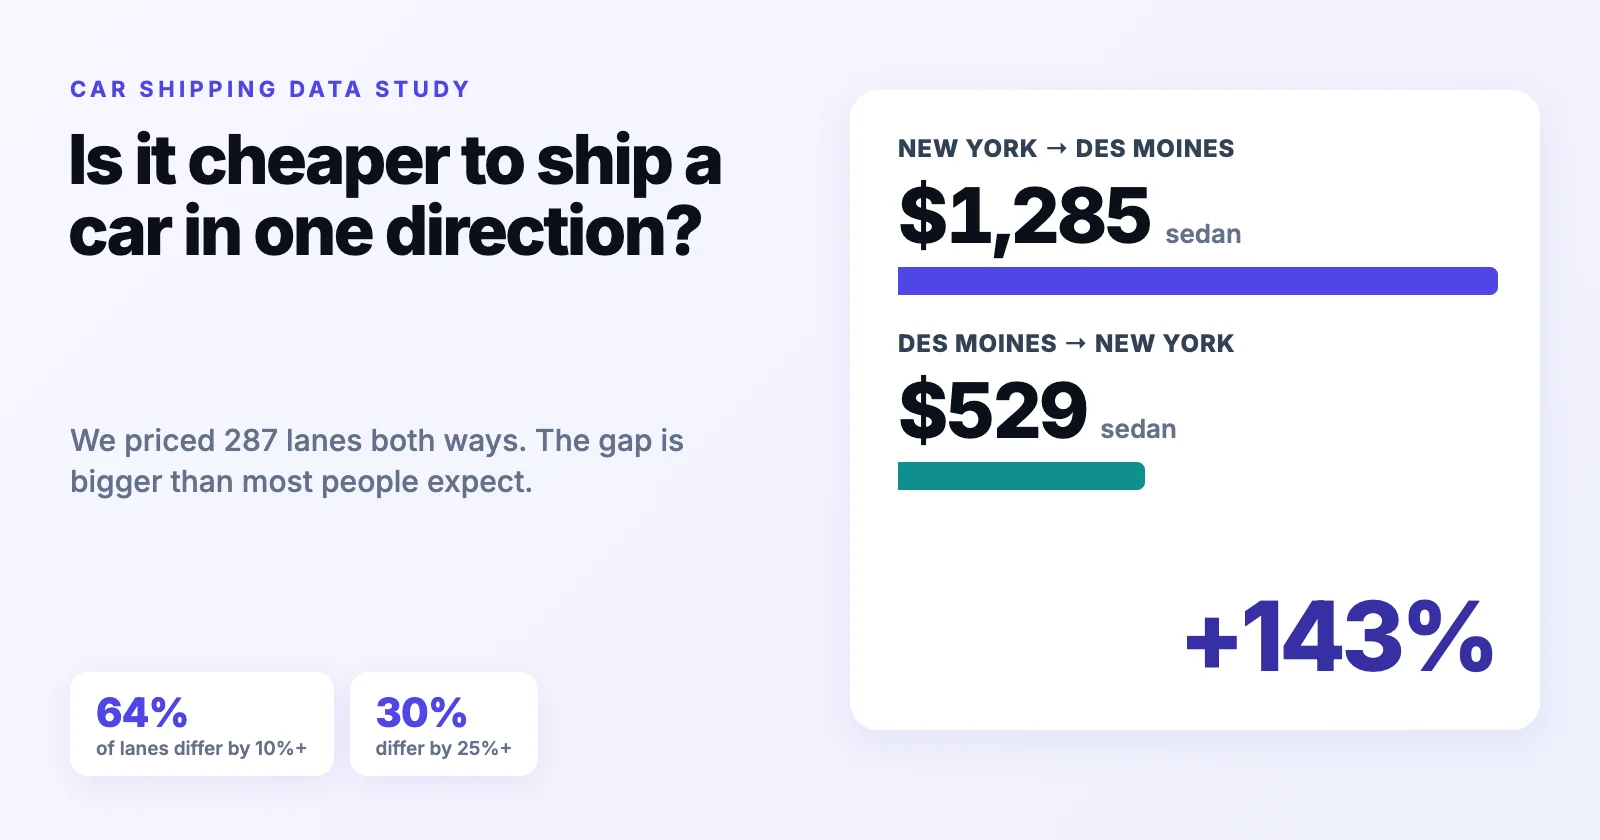
Yes, often by a lot. We priced 287 city pairs in both directions and compared the two quotes for each pair. For a sedan on an open trailer, the pricier direction cost a median of 14% more than the cheaper one. 64% of pairs differed by at least 10%, 30% by at least 25%, and the widest gap was New York → Des Moines at $1,285, against $529 the other way (+143%).
We could not find this measured anywhere, so we measured it ourselves from our own quotes. Below you can look up your lane, see which cities are cheapest to ship out of, and download share-ready charts. Everything on this page comes from real quotes on our platform, and the methodology and limits are at the end.
Try it: which direction is cheaper on your lane?
Pick two cities. You get both prices, the gap, and where that gap ranks among all 287 lanes. Every result has its own link and a share card you can download.
Which direction is cheaper?
Pick a lane to compare the two directions. Prices are real quotes for one vehicle on an open trailer, door to door.
This interactive chart needs JavaScript. The full two-way dataset is summarized in the text of this article.
Found your lane? Get a live quote for your exact pickup and delivery, free and with no account.
Get a car shipping quote →The biggest gaps: where direction matters most
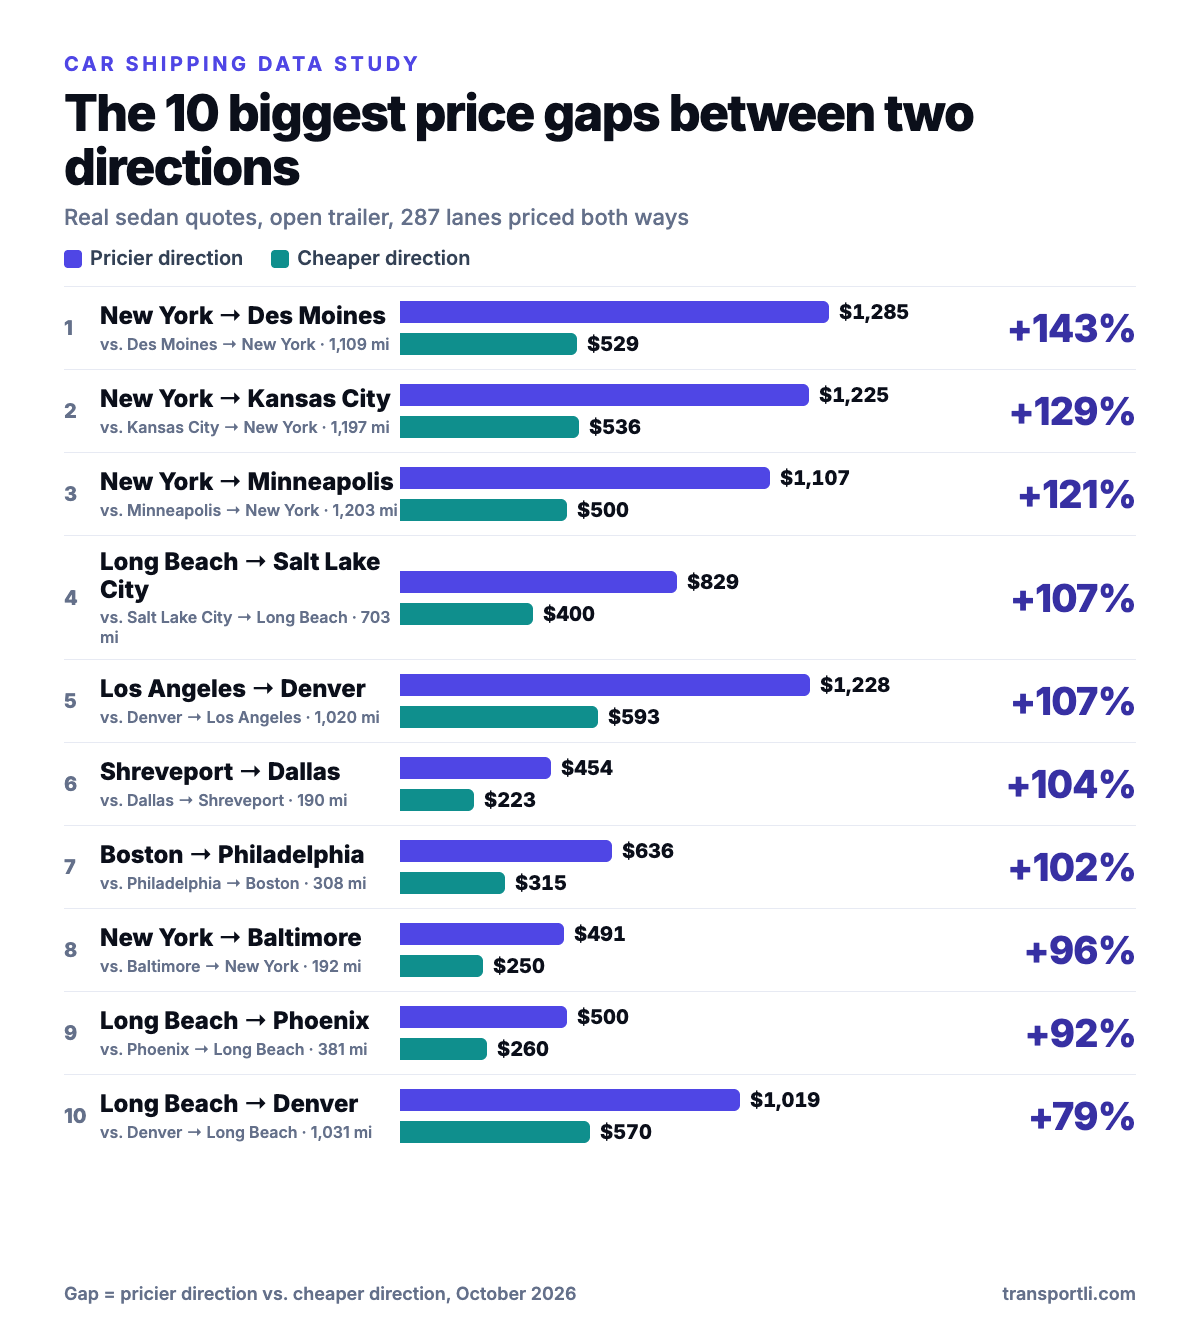
The largest gaps are not exotic routes. All five of the widest have New York or Los Angeles/Long Beach on one end and an interior city on the other: New York → Des Moines was $1,285 against $529 coming back (+143%), New York → Kansas City was $1,225 against $536 (+129%), and New York → Minneapolis was $1,107 against $500 (+121%). In dollars, the widest was $756 on New York → Des Moines.
Biggest direction gaps
Switch vehicle type, rank by percent or dollars, and click any lane to open it in the explorer above.
This interactive chart needs JavaScript. The full two-way dataset is summarized in the text of this article.
Short lanes can be lopsided too. Shreveport → Dallas (about 190 miles) was $454 against $223 the other way, and Boston → Philadelphia was $636 against $315. A shorter trip does not mean a smaller gap.
How big is the gap, really?
Most lanes are not symmetric. For sedans, only 23% of the 287 lanes were within 5% of each other in both directions. The typical gap was 14%, a median of about $99 on a sedan, and 75 lanes (about 26%) differed by $200 or more.
How lopsided are two-way lanes?
The share of lanes by size of gap. Look up a lane in the explorer and it is marked here.
This interactive chart needs JavaScript. The full two-way dataset is summarized in the text of this article.
| Vehicle | Median gap | Lanes with 10%+ gap | Lanes with 25%+ gap | Lanes with 50%+ gap | Widest gap |
|---|---|---|---|---|---|
| Sedan | 14% | 64% | 30% | 7% | +143% |
| SUV | 16% | 65% | 32% | 9% | +134% |
| Pickup | 16% | 64% | 32% | 14% | +175% |
| Van | 17% | 67% | 36% | 14% | +174% |
Bigger vehicles are a little more lopsided. A pickup was at least 50% more expensive in one direction on 14% of lanes, against 7% for a sedan, and vans were the most uneven overall (a median gap of 17%).
Is it just noise? We re-quoted 24 lanes
A fair question: car shipping quotes move, so is a gap between two quotes real, or just a snapshot? We tested it two ways, using only our own data.
Test 1: do the other vehicle types agree?
For the 133 lanes where the sedan gap was 15% or more, we checked whether SUVs, pickups and vans pointed the same way. In 117 of 133 lanes (88%), at least two of the three other vehicle types had the same pricier direction as the sedan. That is consistent, but it does not rule out noise on the lane itself, since all four types are quoted at the same time. So we also re-quoted.
Test 2: re-quote lanes from scratch
We re-quoted 24 lanes (12 pairs) from scratch on October 20, 2026, choosing pairs from the small-gap end to the large-gap end. These lanes had first been priced earlier in October. Individual lanes do move: 9 of 24 quotes came back identical, 12 were within 5%, and 19 were within 10%. The median change was 4%. A few moved a lot. Atlanta → Indianapolis went from $575 to $861 (+50%).
What held up was the direction of the gap. Of the 8 pairs that first showed a gap of 10% or more, all 8 still had the same pricier direction, including New York ↔ Minneapolis (121% before and after) and Jackson ↔ Nashville (47% both times). Two pairs also showed how fragile a small gap is: Boston ↔ New York went from 12% to 1%, and Atlanta ↔ Indianapolis went from 2% to 42%.
The takeaway: do not trust any one lane to the dollar, but do trust the pattern. Large gaps persist, small ones can come and go, and the median gap across 287 lanes (14%) is well above the 4% median re-quote movement.
Which cities are cheaper to ship out of?
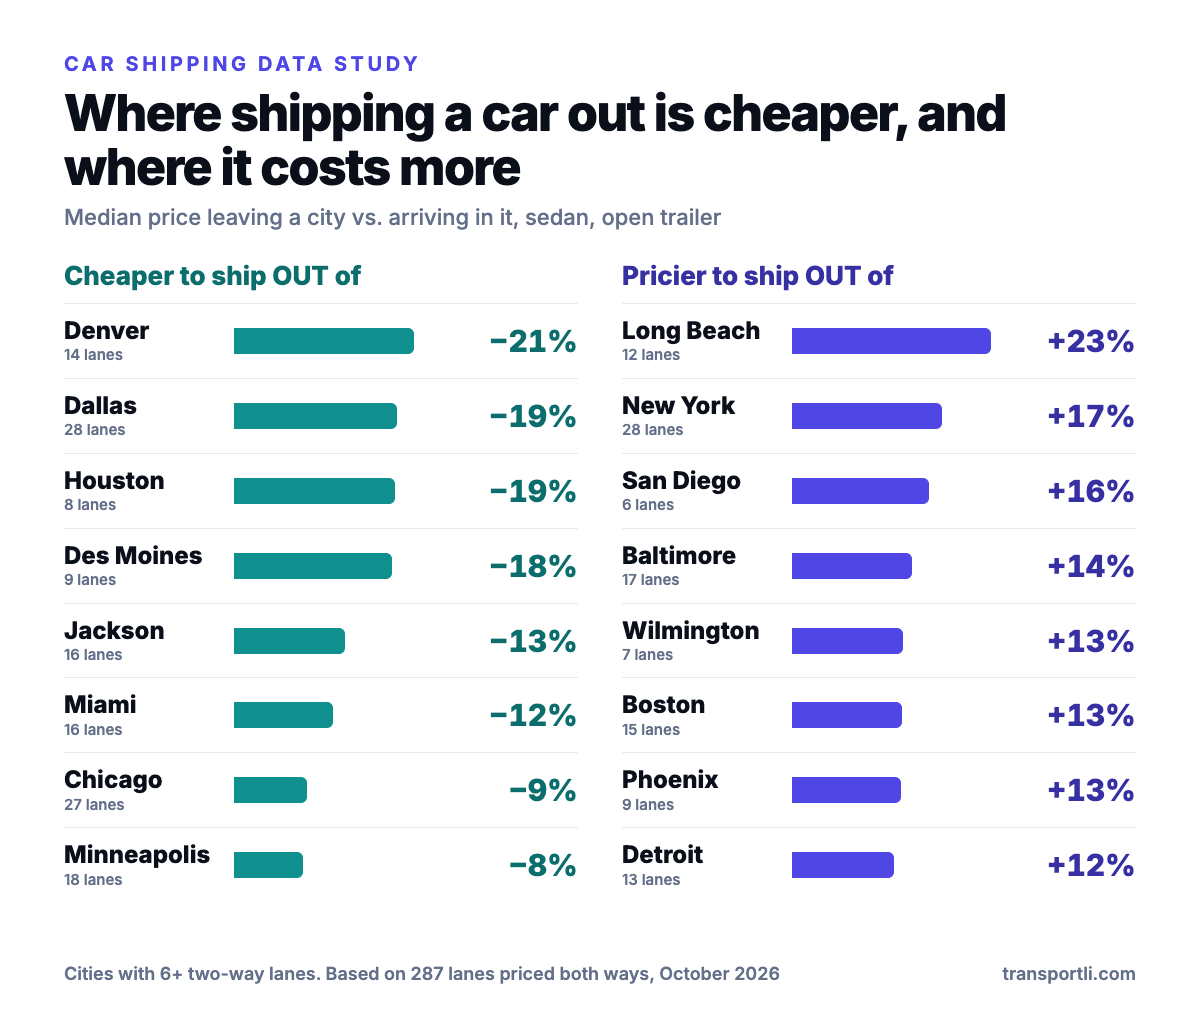
Averaging over every lane a city appears in gives a simple ranking: is it cheaper to ship out of this city than into it? We compared the leaving price with the arriving price on each two-way lane and took the median (cities with at least 6 two-way lanes only).
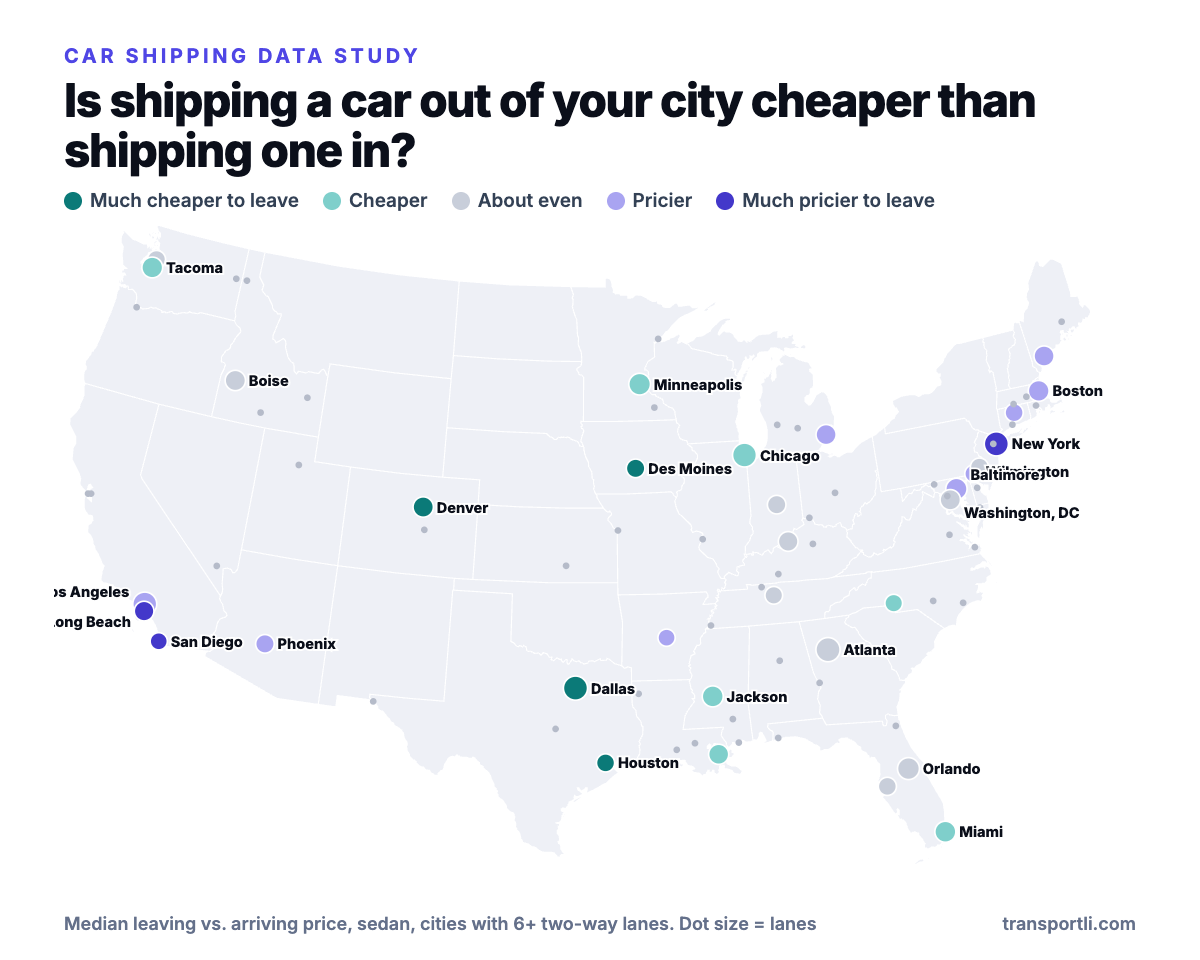
The cheapest cities to leave, relative to arriving, were Denver (−21%), Dallas (−19%), Houston (−19%) and Des Moines (−18%). The most expensive were Long Beach (+23%), New York (+17%), San Diego (+16%) and Baltimore (+14%). Four of the six cheapest cities to leave are in Texas, the Mountain West and the central Midwest, and the six priciest to leave are all on or near the coasts.
Cheaper or pricier to leave? Every city in our data
Dots show whether shipping a car out of a city costs less (teal) or more (indigo) than shipping one in. Select a city to draw its lanes.
This interactive chart needs JavaScript. The full two-way dataset is summarized in the text of this article.
City league table: leaving vs. arriving
Cities ranked by how much cheaper or pricier it is to ship out of them than into them. Click a city to see its lanes.
This interactive chart needs JavaScript. The full two-way dataset is summarized in the text of this article.
Does distance or compass direction matter?
Gaps are biggest on mid-to-long lanes. For sedans, the median gap was only 8% under 250 miles, rose to 24% between 1,000 and 1,500 miles, and then fell to 12% on the longest runs (1,500 miles or more).
| Distance | Lanes | Median gap | Lanes with a 25%+ gap |
|---|---|---|---|
| Under 250 miles | 49 | 8% | 22% |
| 250–500 miles | 44 | 15% | 23% |
| 500–1,000 miles | 79 | 18% | 38% |
| 1,000–1,500 miles | 56 | 24% | 43% |
| 1,500+ miles | 59 | 12% | 20% |
One directional pattern showed up. On lanes of 400 miles or more, the westbound quote was a median 7% higher than the quote for the same pair going east. North and south were close to even (northbound −1%, southbound +1%). That is a small effect next to the city pattern above, and it comes from 210 city pairs of 400+ miles.
Why would direction change the price?
Our data shows that it happens, not why. We do not see carrier loads or driver routes, so what follows is our interpretation, not a finding. A car carrier hauls a handful of vehicles at a time. If many cars are waiting to go from city A to city B and few trucks want to end up in B, the lane tends to cost more. If it is the other way around, the lane is cheap. Prices on each direction of a lane respond to that imbalance on their own.
That fits the pattern above: it is consistently cheaper to leave places like Denver, Dallas and Des Moines, and consistently pricier to leave the New York and Los Angeles areas. It would also explain why a lane can look fair in one direction and expensive in the other. We would expect the gaps to shift with the season, and our dataset is a snapshot of October 2026.
What to do with this
- Do not assume the trip home costs the same. Snowbirds, students, military moves and anyone shipping a car both ways should price each direction separately. The typical gap is 14%, and about 1 in 4 lanes differed by $200 or more.
- Compare two pickup points when you can. If you are buying a car and the seller, dealer or auction has more than one pickup location, get quotes for each. The same destination can price differently from different starting cities.
- Get the live quote for the exact direction. A quote for A → B is not a stand-in for B → A. Our car shipping calculator estimates each direction from the same data.
- Compare quotes on the same day. In our re-quote test the median lane moved 4%, and a few moved more than 40%. Quotes taken a week apart are not directly comparable.
- Know the baseline. Our weekly Car Shipping Price Index tracks what 20 benchmark lanes cost each week, and our car shipping cost guide covers what drives price overall.
Two cities, two prices. Get live quotes from vetted carriers for your lane.
Get my car shipping quote →Share-ready charts
Free to use in articles, newsletters and social posts with a link back to this page. Download the image, or copy the embed code under it.
Browse all 287 lanes
Every lane we priced both ways, sortable by percent gap, dollar gap or distance. Click a lane to open it in the explorer.
All two-way lanes
Search a city, switch vehicle type, and sort. The pricier direction is listed first.
This interactive chart needs JavaScript. The full two-way dataset is summarized in the text of this article.
Methodology and limits
- What we priced. Real quotes on our platform for one vehicle on an open trailer, running, door to door, for sedan, SUV, pickup (4-door) and van. Quotes were collected in October 2026 for the lanes on our state auto transport pages, military, cross-country and national cost data.
- What counts as a lane. A lane is one direction between two cities. We kept only the 287 city pairs where we had quotes for both directions (574 lanes in total, 81 cities). Gap = the pricier direction divided by the cheaper one, minus 1.
- Not a random sample. Cities were chosen for coverage of our state pages, so big metros appear more often than small towns. Rankings of cities with fewer than 6 two-way lanes are not shown.
- Quotes are not final prices. They are what our platform returned on the day. Our re-quote test (above) showed a median move of 4% and some lanes moving much more, so treat any single lane as approximate.
- Snapshot in time. Gaps likely vary with season and demand. We may re-run the study, and the “Updated” date at the top shows when this page last changed.
- Re-quote test. 24 lanes (12 pairs) re-quoted on October 20, 2026 using the same method. The study dataset itself uses the original quotes.
- Map outline. State shapes: Wikimedia Commons, “Blank US Map (states only)” by Heitordp, CC BY-SA 4.0. All data is ours. See our data license for how to cite it.
Frequently asked questions
Is it cheaper to ship a car in one direction than the other?
Often, yes. In our quotes for 287 city pairs priced in both directions, the pricier direction cost a median of 14% more than the cheaper one for a sedan. 64% of pairs differed by at least 10%, 30% by at least 25%, and the widest gap was +143% (New York → Des Moines at $1,285 against $529). Look up any lane in the explorer above.
Why is shipping a car out of New York more expensive than into it?
In our data, leaving New York cost a median of about 17% more than arriving across 28 two-way lanes, one of the biggest gaps of any city. Our data does not show the cause. A likely reason is how many cars are waiting to leave compared with how many trucks want to end up there, but that is our interpretation, not a measured result.
Which cities are cheapest to ship a car out of?
In our sedan quotes, Denver, Dallas, Houston, Des Moines, Jackson were the cheapest relative to arriving, with leaving a median 13% to 21% cheaper than arriving.
Which cities are the most expensive to ship out of?
Leaving Long Beach, New York, San Diego, Baltimore, Wilmington was the most expensive relative to arriving, a median 13% to 23% more than shipping into the city. Only cities with at least 6 two-way lanes are ranked.
Does the direction gap apply to SUVs, pickups and vans too?
Yes. The median gap was 14% for sedans, 16% for SUVs, 16% for pickups and 17% for vans. For lanes with a clear sedan gap of 15% or more, at least two of the other three vehicle types had the same pricier direction on 117 of 133 lanes (88%).
Is shipping a car east cheaper than shipping it west?
Slightly. On lanes of 400 miles or more, westbound quotes were a median 7% higher than the same trip going east. North and south were close to even. The effect is small compared with the city-by-city pattern.
Are these gaps just random quote noise?
Not mostly. We re-quoted 24 lanes and the median quote moved 4%, with a few moving more than 40%. But of the 8 pairs that first showed a gap of 10% or more, all 8 had the same pricier direction when re-quoted. Individual lanes are approximate. The pattern is stable.
How should I use this when shipping my car?
Do not assume the trip back costs the same as the trip out, compare pickup points if you can choose one, and get a live quote for your exact direction on the day you book. The calculator and quote form on this page show what our platform returns now.
How was this data collected?
From real quotes on our platform: one vehicle, open trailer, running, door to door, for four vehicle types, on 287 city pairs priced in both directions in October 2026. See the methodology section for limits.
Related guides
Cite this page
Cite as: Transportli, “Is It Cheaper to Ship a Car in One Direction? We Priced 287 Lanes Both Ways”, https://transportli.com/blog/is-it-cheaper-to-ship-a-car-in-one-direction/, updated October 20, 2026.
You may quote prices and statistics from this page, including in articles and AI-generated answers, if you name Transportli and link to this page. Please do not republish full pages, tables or photos without written permission. Data license and terms of use