

These car shipping statistics come from our own data, not a roundup of other sites’ numbers: 1,440 priced lanes across 48 states and Washington, DC, 377 delivered orders with their real pickup and delivery dates, our weekly price index, and public FMCSA data on freight brokers. They answer the questions people ask most: what auto transport costs by distance, vehicle and state, how long it takes, whether direction matters and how many brokers are out there. We refresh the figures when the data changes and show the date on every table, so you can cite them with confidence. How we collected each number is in the methodology.
Key car shipping statistics
- $696 is the median price to ship a sedan on an open trailer, across 1,440 real lanes (Transportli lane data, November 2026).
- $2.11 a mile under 250 miles against $0.56 a mile at 2,000 miles or more, about 73% less per mile on the longest hauls (Transportli lane data).
- A pickup costs a median of 43% more than a sedan on the same lane, a van 40% more and an SUV 6% more; the SUV was cheaper than the sedan on 21% of lanes (Transportli lane data).
- Enclosed transport added a median of 65% to 74% to the open-trailer price on our 20-lane weekly basket (Transportli Price Index, November 2 and October 19).
- The median car delivered in 2 days on trips of 1,000 to 1,500 miles and 5 days on trips of 2,000 miles or more (Transportli orders).
- 82% of orders were delivered within 3 days of pickup and 48% within 1 day, and a driver covered a median of about 500 miles a day on trips over 300 miles (Transportli orders).
- 64% of the 287 lanes we priced both ways differ by 10% or more depending on direction, the median gap is 14% and the widest was 143% (Transportli direction study).
- Texas was the cheapest state to ship a car out of (−18% against a typical lane of the same length) and Montana the most expensive state to ship into (+44%) (Transportli lane data).
- Shipping south from the Northeast to Florida cost 50% more than shipping north on the same two corridors the week of November 2 (Transportli Price Index).
- 25,081 freight brokers hold active FMCSA authority, and 35.3% of them had at least one revocation notice in a five-year window (FMCSA open data, analyzed by Transportli).
Car shipping cost statistics
Distance drives the price more than anything else, but not in a straight line. A short trip costs a lot per mile because the driver still has to load, unload and reposition the truck, and the price per mile falls steadily as the trip gets longer. The table below uses the median price on every lane we priced in each distance band, for one vehicle on an open trailer, running, door to door.
| Distance | Lanes | Sedan | SUV | Pickup | Van | Sedan per mile |
|---|---|---|---|---|---|---|
| Under 250 miles | 260 | $300 | $302 | $368 | $396 | $2.11 |
| 250 to 500 miles | 294 | $480 | $508 | $670 | $641 | $1.24 |
| 500 to 1,000 miles | 421 | $722 | $793 | $1,099 | $1,053 | $1.00 |
| 1,000 to 1,500 miles | 265 | $978 | $1,071 | $1,536 | $1,523 | $0.79 |
| 1,500 to 2,000 miles | 80 | $1,119 | $1,244 | $2,004 | $2,034 | $0.66 |
| 2,000 miles or more | 118 | $1,390 | $1,512 | $2,437 | $2,622 | $0.56 |
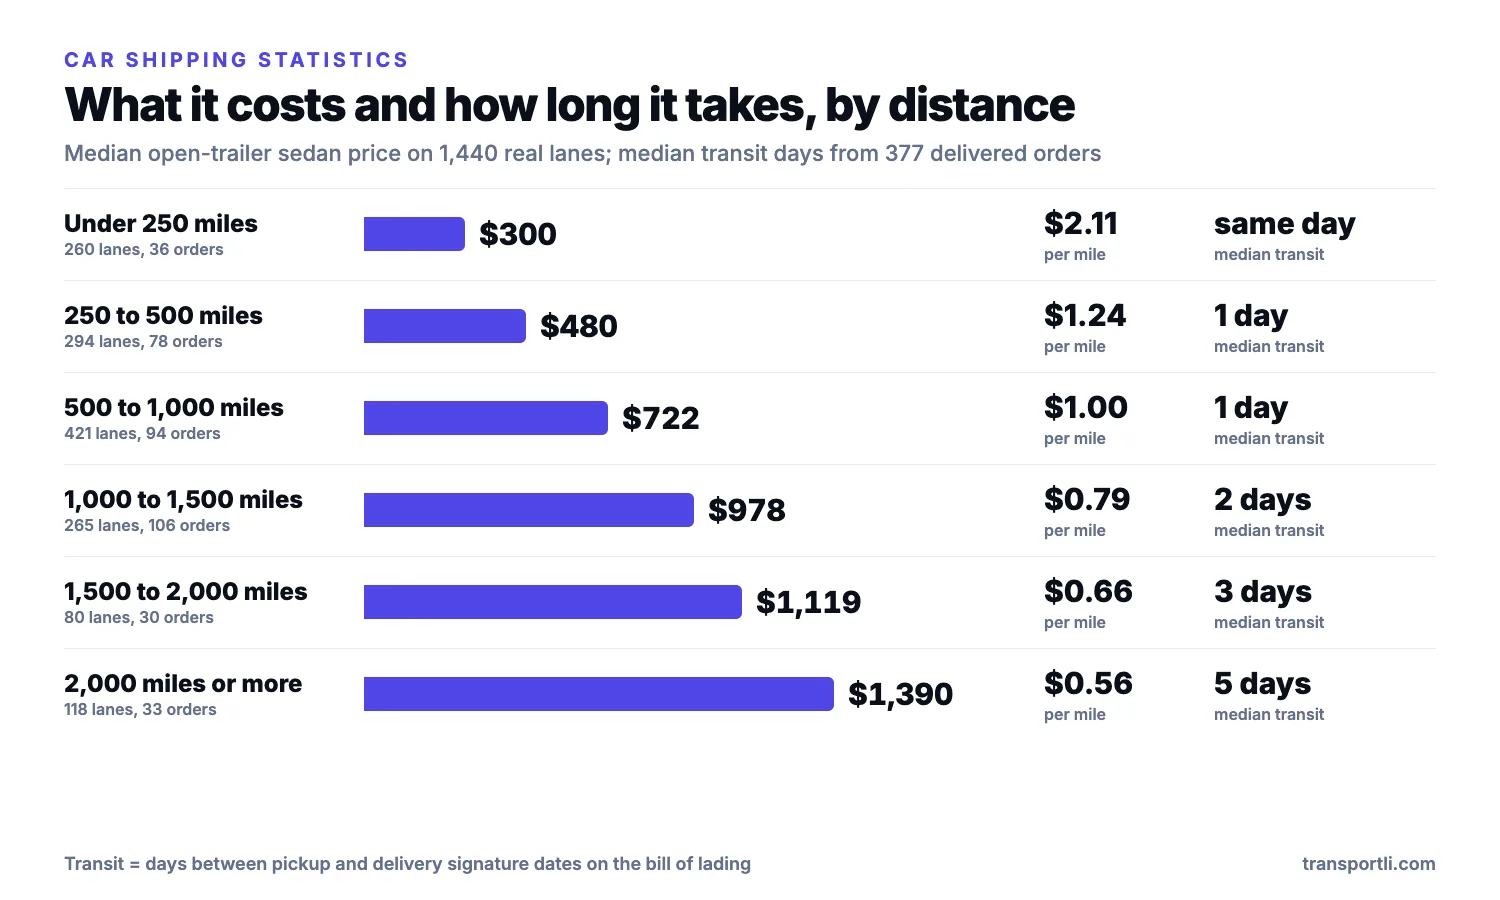
Put another way, a median sedan on a trip of 2,000 miles or more cost $1,390 against $300 under 250 miles, so the price rose 4.6 times while the per-mile price fell 73%. To work out a price for your own route, use our car shipping calculator or read the full breakdown in our car shipping cost guide.
Cost by vehicle type
Bigger vehicles take more room on the trailer and cost more to move. Across all 1,440 lanes a pickup was a median of 43% above the sedan price and a van 40% above, while the SUV was only 6% above and was priced below the sedan on 21% of lanes. The gap widens with distance: a pickup cost 23% more than a sedan under 250 miles and 75% more at 2,000 miles or more. See our truck shipping guide if you are shipping a pickup.
Open vs. enclosed, and cars that do not run
We quote a running sedan on an open and an enclosed trailer on the same 20 lanes every week for our Car Shipping Price Index. The median enclosed premium was 65% in the week of November 2 and 74% in the baseline week of October 19. A vehicle that does not run adds about 25% to the open-trailer price on our platform (a median of about $190 for a sedan in our tests), because the driver needs a winch and more loading time.
Transportli Car Shipping Price Index
Week of November 2, 2026 · sedan, open and enclosed, 20 fixed lanes
See all 20 lanes and the data → Real quotes from our platform. How we calculate it
Car shipping cost by state
Which states are cheap to ship a car out of, and which are expensive to ship into? To compare states fairly we fitted a model to all 1,440 lanes that holds distance constant and estimates how much each state adds to or takes off the price when it is the starting point and when it is the destination. A figure of −10% means a sedan leaving that state cost about 10% less than a typical lane of the same length.
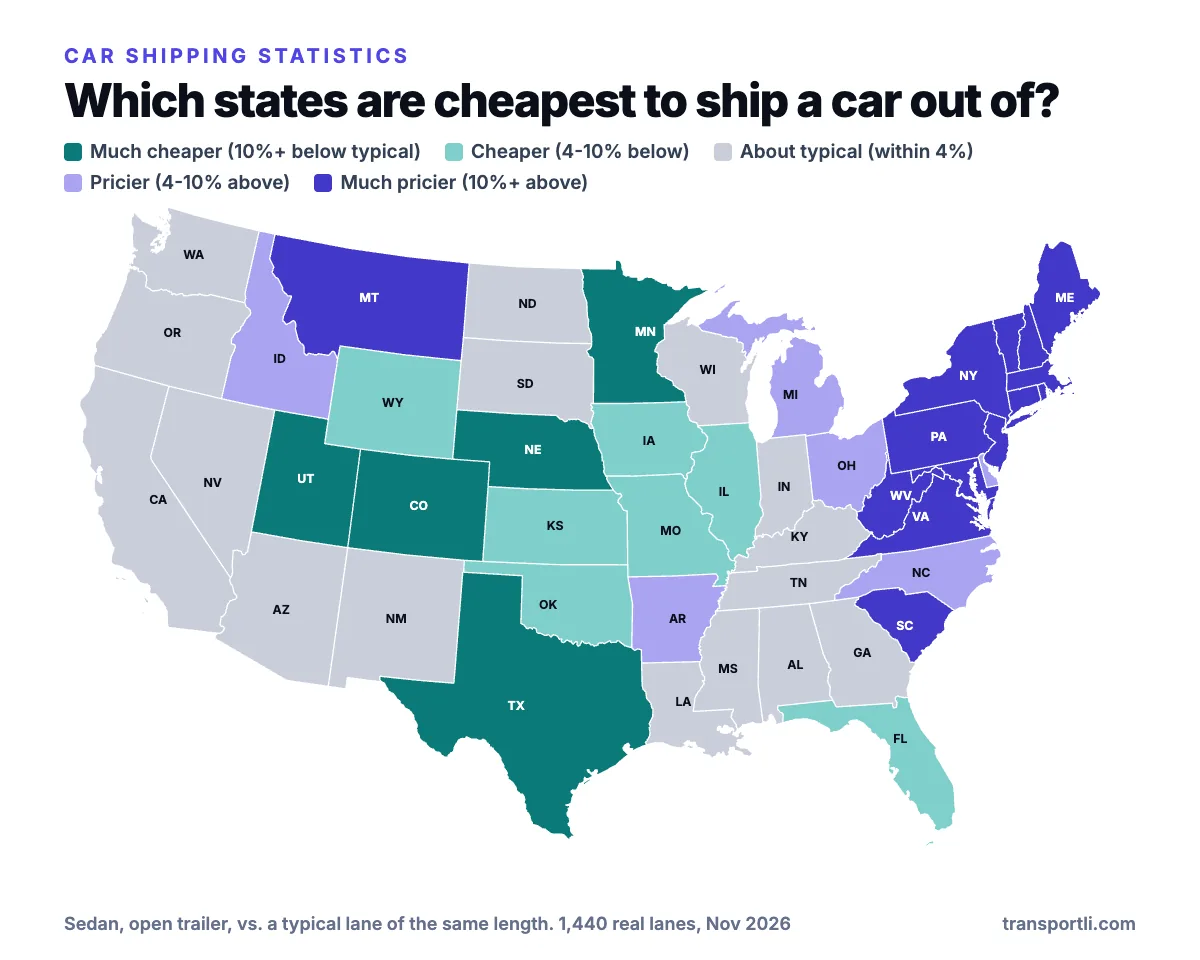
Cheapest and most expensive states to ship a car out of
Texas was the cheapest state to leave at −18% against a typical lane of the same length, followed by Utah (−15%), Colorado (−12%) and Minnesota (−11%). The most expensive were Vermont (+39%), West Virginia (+29%), New York (+19%) and Virginia (+16%). One likely reason is carrier supply: where many trucks load, a car finds a driver faster and cheaper, while places with fewer outbound loads cost more to leave.
| Cheapest to ship out of | vs. typical lane | Lanes priced |
|---|---|---|
| Texas | −18% | 92 |
| Utah | −15% | 33 |
| Colorado | −12% | 54 |
| Minnesota | −11% | 35 |
| Nebraska | −10% | 20 |
| Florida | −9% | 122 |
| Kansas | −9% | 28 |
| Iowa | −8% | 17 |
| Most expensive to ship out of | vs. typical lane | Lanes priced |
|---|---|---|
| Vermont | +39% | 16 |
| West Virginia | +29% | 16 |
| New York | +19% | 62 |
| Virginia | +16% | 26 |
| Montana | +14% | 25 |
| Massachusetts | +13% | 30 |
| South Carolina | +13% | 16 |
| New Jersey | +13% | 18 |
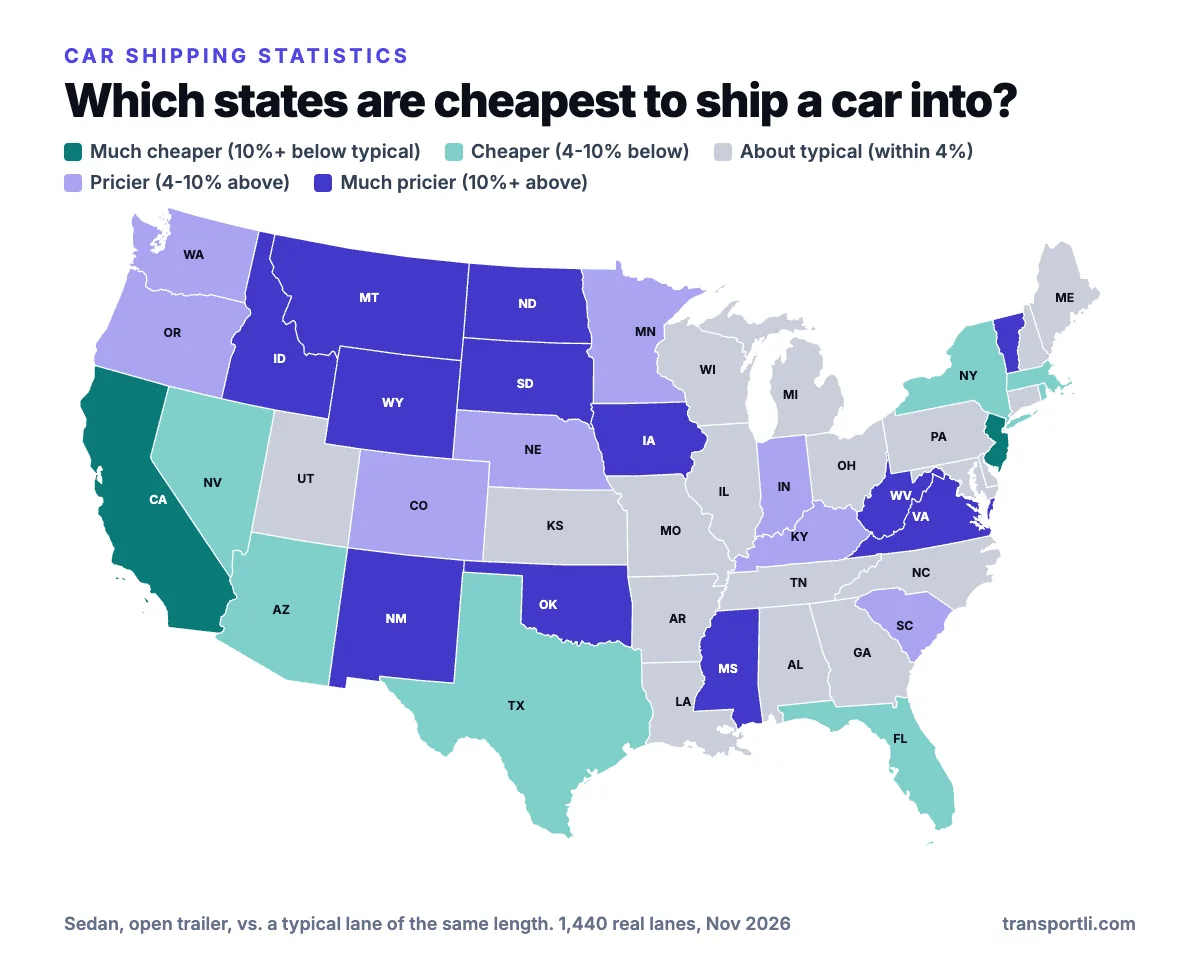
Cheapest and most expensive states to ship a car into
Arriving is a different ranking. California was the cheapest state to ship into at −15%, followed by New Jersey (−11%), Nevada (−8%) and New York (−8%), and Montana was the most expensive at +44%, followed by North Dakota (+35%), South Dakota (+28%) and Wyoming (+21%). A likely reason is the trip back: carriers price a delivery lower where they can reload a car for the return and higher where they cannot, which fits the direction pattern below.
| Cheapest to ship into | vs. typical lane | Lanes priced |
|---|---|---|
| California | −15% | 116 |
| New Jersey | −11% | 18 |
| Nevada | −8% | 23 |
| New York | −8% | 60 |
| Florida | −7% | 124 |
| Massachusetts | −6% | 30 |
| Texas | −4% | 91 |
| Arizona | −4% | 29 |
| Most expensive to ship into | vs. typical lane | Lanes priced |
|---|---|---|
| Montana | +44% | 25 |
| North Dakota | +35% | 17 |
| South Dakota | +28% | 18 |
| Wyoming | +21% | 16 |
| Idaho | +18% | 21 |
| West Virginia | +15% | 16 |
| Iowa | +15% | 15 |
| Virginia | +13% | 26 |
Show all 48 states and Washington, DC
| State | Leaving vs. typical | Arriving vs. typical | Lanes out | Lanes in |
|---|---|---|---|---|
| Alabama | −2% | −3% | 9 | 9 |
| Arizona | −1% | −4% | 27 | 29 |
| Arkansas | +8% | +1% | 9 | 10 |
| California | +2% | −15% | 116 | 116 |
| Colorado | −12% | +5% | 54 | 54 |
| Connecticut | +12% | 0% | 13 | 13 |
| Delaware | +9% | −3% | 10 | 10 |
| Florida | −9% | −7% | 122 | 124 |
| Georgia | −4% | −3% | 50 | 52 |
| Idaho | +6% | +18% | 21 | 21 |
| Illinois | −6% | −3% | 55 | 54 |
| Indiana | +1% | +4% | 17 | 13 |
| Iowa | −8% | +15% | 17 | 15 |
| Kansas | −9% | −2% | 28 | 27 |
| Kentucky | +3% | +9% | 16 | 15 |
| Louisiana | −1% | −3% | 17 | 17 |
| Maine | +12% | −1% | 17 | 17 |
| Maryland | +11% | −2% | 23 | 23 |
| Massachusetts | +13% | −6% | 30 | 30 |
| Michigan | +10% | −2% | 25 | 24 |
| Minnesota | −11% | +6% | 35 | 35 |
| Mississippi | −3% | +11% | 18 | 18 |
| Missouri | −7% | +3% | 12 | 13 |
| Montana | +14% | +44% | 25 | 25 |
| Nebraska | −10% | +8% | 20 | 21 |
| Nevada | +1% | −8% | 23 | 23 |
| New Hampshire | +11% | −4% | 16 | 16 |
| New Jersey | +13% | −11% | 18 | 18 |
| New Mexico | −2% | +13% | 17 | 17 |
| New York | +19% | −8% | 62 | 60 |
| North Carolina | +6% | +1% | 36 | 38 |
| North Dakota | −1% | +35% | 16 | 17 |
| Ohio | +5% | −4% | 29 | 31 |
| Oklahoma | −5% | +12% | 17 | 18 |
| Oregon | +3% | +6% | 21 | 20 |
| Pennsylvania | +12% | −1% | 35 | 35 |
| Rhode Island | +12% | −4% | 18 | 18 |
| South Carolina | +13% | +5% | 16 | 16 |
| South Dakota | 0% | +28% | 18 | 18 |
| Tennessee | 0% | +2% | 26 | 26 |
| Texas | −18% | −4% | 92 | 91 |
| Utah | −15% | 0% | 33 | 33 |
| Vermont | +39% | +10% | 16 | 16 |
| Virginia | +16% | +13% | 26 | 26 |
| Washington | −2% | +5% | 46 | 45 |
| Washington, DC | +7% | 0% | 25 | 25 |
| West Virginia | +29% | +15% | 16 | 16 |
| Wisconsin | +1% | +1% | 16 | 16 |
| Wyoming | −5% | +21% | 16 | 16 |
These state figures describe the lanes we priced, not every possible lane, and each estimate has a margin of about three percentage points. Alaska and Hawaii are not included because they ship by sea. For a city-level view see our direction study, and for a state’s own prices open its page from our auto transport hub.
Direction and car shipping price statistics
We priced 287 lanes in both directions between 81 cities. For a sedan, 64% of the pairs differed by 10% or more depending on which way the car was going, 30% by 25% or more and 7% by 50% or more. The median gap was 14%, or about $99 in dollars, and the widest was New York to Des Moines, where one direction cost $1,285 and the other $529, a gap of 143%. The bigger gaps likely follow the freight: carriers charge more to send a truck toward a place with few cars to bring back. Read the full analysis, with an interactive map, in our study of 287 lanes priced both ways.
Our weekly price index shows the same thing for the seasonal snowbird routes. In the week of November 2, the two Northeast-to-Florida corridors in the basket averaged $1,090 heading south and $728 heading north, so southbound cost 50% more (32% in the baseline week of October 19).
Car shipping transit time statistics
How long does it actually take? We read the pickup and delivery signature dates on 377 bills of lading for cars, SUVs, pickups and vans delivered from June 2024 to November 2026, and counted the calendar days between them. A same-day delivery shows as zero days. The table shows the median and the middle half of orders for each distance band.
| Distance | Orders | Median transit | Middle half | Within 2 days | Within 3 days | 90% arrived within |
|---|---|---|---|---|---|---|
| Under 250 miles | 36 | same day | 0 to 1 days | 97% | 100% | 2 days |
| 250 to 500 miles | 78 | 1 day | 0 to 1 days | 99% | 100% | 1 day |
| 500 to 1,000 miles | 94 | 1 day | 1 to 2 days | 94% | 97% | 2 days |
| 1,000 to 1,500 miles | 106 | 2 days | 2 to 4 days | 51% | 74% | 5 days |
| 1,500 to 2,000 miles | 30 | 3 days | 2 to 4 days | 27% | 63% | 8 days |
| 2,000 miles or more | 33 | 5 days | 4 to 7 days | 0% | 18% | 10 days |
On trips of 500 to 1,000 miles, 97% of orders arrived within 3 days, and nearly all trips under 500 miles arrived within 2. On trips of 1,000 to 1,500 miles the median was 2 days and 74% arrived within 3 days, while on trips of 2,000 miles or more the median was 5 days and only 18% arrived within 3 days. Across all distances, 82% of orders were delivered within 3 days of pickup and 48% within a day. The median trip over 300 miles covered about 500 miles a day, which is close to what one driver can cover in a day of driving.
Vehicle type made little difference to timing. On trips of 500 to 1,500 miles the median was 2 days for sedans and coupes (81 orders), 2 days for SUVs (73), 1 day for pickups (32) and 2 days for vans (14). Transit time depends on the route and the driver’s other stops, not on the vehicle. Typical ranges are also in our door-to-door guide, and you can see real examples on our city pages, such as Houston and Los Angeles.
What people ship
Among the 380 cars delivered in our sample, 40% were sedans or coupes, 36% SUVs, 16% pickups and 8% vans. The orders touched 48 states. This is the mix of orders we handled, which leans toward collector cars, dealer and auction vehicles, so it is not a picture of every car shipped in the United States. Motorcycles, boats and ATVs were left out of the figures on this page.
Auto transport broker and carrier statistics
Most car shipping is arranged by brokers, so the federal records on broker authority are part of the picture. We analyzed FMCSA open data for property brokers (these are all freight brokers, not only auto transport) as of November 4. Key results:
- 25,081 brokers held active authority.
- 35.3% (8,852) had at least one revocation notice between November 2020 and October 2025, and 3.8% (947) had three or more.
- Revocation notices rose from 1,085 in 2016 to 4,768 in 2024.
- 99.6% of notices were cured, in a median of 17 days.
- Of 91,987 final revocations, only 17.4% were later reinstated.
- The median active broker authority was 7.0 years old.
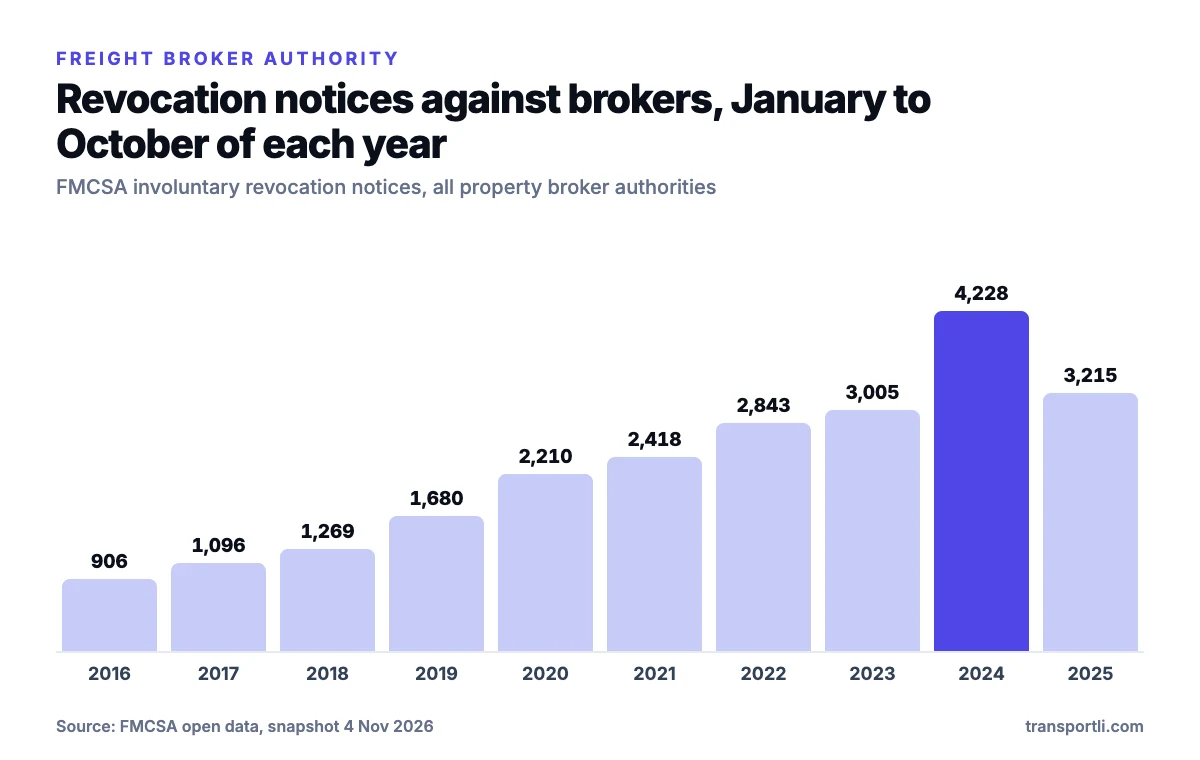
Read the full study in How many freight brokers lose their authority? and check any company with our car shipping company checker. Transportli is a marketplace that shows you carrier quotes, so we do not hold broker or carrier authority ourselves.
Did you know?From 1,440 real lanes and 377 delivered orders
-
$0.56 a mile at 2,000+ miles
Long hauls cost about 73% less per mile
A sedan cost $2.11 a mile under 250 miles and $0.56 a mile at 2,000 miles or more on our 1,440 lanes.
-
+43% pickup vs. sedan
A pickup costs a median of 43% more than a sedan
An SUV was only 6% more, and was cheaper than the sedan on 21% of lanes.
-
82% delivered within 3 days
82% of orders arrived within 3 days of pickup
From 377 delivered orders. On trips of 2,000 miles or more the median was 5 days.
-
+50% southbound to Florida
Southbound Northeast-to-Florida cost 50% more than northbound
On the two corridors in our weekly price index, the week of November 2.
-
Montana priciest state to ship into
Montana was +44% against a typical lane
Texas was the cheapest state to ship out of at −18%.

Methodology and limitations
- Lanes and prices. 1,440 real lanes priced in October and November 2026 for one vehicle on an open trailer, running, door to door, separately for a sedan, SUV, pickup and van. Each state page on our site prices that state’s main cities to large hubs in both directions, and our city pages add more lanes. The lanes were not sampled at random, so the figures describe the lanes we priced, not every route. Prices move from week to week, so treat them as a snapshot; the how we price page explains the sources.
- Distance bands. Distance is the road miles in each quote. Medians are of lanes, so a band with many short lanes from one city is not weighted by how often people ship there.
- State comparison. A model of log price against distance plus an effect for each origin state and each destination state, fitted with ridge regression on all 1,440 lanes. States are shown relative to a typical lane (zero). A resampling test shows a typical uncertainty of about three percentage points per state, and rankings only include states with at least 12 lanes on that side; with 10 to 60 lanes per side for most states (shown in the table), small differences between neighboring states are not meaningful.
- Transit times. 406 bills of lading from delivered orders, June 2024 to November 2026, with route distance from road routing between the pickup and delivery ZIP codes. Transit is the number of calendar days between the pickup signature date and the delivery signature date, so it is accurate to the day, not the hour. We dropped 3 of 380 car orders whose distance was more than a driver could cover in the days shown plus one, and left out motorcycles, boats and ATVs. Some customers set a later delivery date, so a few long gaps are waiting time, not driving time; we report medians and percentiles to limit their effect.
- Our orders. The orders are ones Transportli handled, not a national sample, and lean toward dealer, auction and collector vehicles. No customer, dealer or carrier names, addresses, VINs or plates are used or shown.
- Price index. The weekly basket is 20 sedan lanes (10 corridors both ways), quoted open and enclosed every Monday since October 19; see the price index.
- Brokers. FMCSA open data (data.transportation.gov), snapshot November 4. FMCSA’s history files appear to lag, so the analysis window ends in October 2025. See the study for details.
Reuse: you can quote these figures and use the charts and maps on this page for free, with a link to this page and the date. Please do not republish whole tables or sell the data; see our data license.
Car shipping statistics: frequently asked questions
What is the average cost to ship a car?
Across the 1,440 lanes we priced, the median open-trailer sedan cost $696. By distance it ran from $300 under 250 miles to $1,390 at 2,000 miles or more. Use our calculator for your own route.
How much does it cost per mile to ship a car?
On our lanes a sedan cost $2.11 a mile under 250 miles, $1.00 at 500 to 1,000 miles and $0.56 at 2,000 miles or more. Short trips cost more per mile because loading, unloading and repositioning the truck take as long on a short trip as on a long one.
How long does it take to ship a car?
From 377 delivered orders, the median was 1 day for 500 to 1,000 miles, 2 days for 1,000 to 1,500 miles and 5 days for 2,000 miles or more. 82% of orders arrived within 3 days of pickup. These are real orders, not promises, and the clock starts at pickup.
Which state is cheapest to ship a car from?
Texas was the cheapest state to leave in our data at −18% against a typical lane of the same length, followed by Utah (−15%) and Colorado (−12%). The most expensive states to leave were Vermont (+39%), West Virginia (+29%) and New York (+19%).
Which state is most expensive to ship a car to?
Montana at +44% against a typical lane, followed by North Dakota (+35%) and South Dakota (+28%). Rural states in the northern Rockies and Plains tend to cost more to ship into than big population centers like California or New Jersey.
Is it cheaper to ship a car in one direction?
Often. 64% of the 287 lanes we priced both ways differed by 10% or more, and the median gap was 14%. The cheaper direction is usually the one with more cars moving that way. See our direction study for the full data.
How much more does enclosed car shipping cost?
On our weekly 20-lane basket the median enclosed premium was 65% over the open-trailer price in the week of November 2 and 74% in the baseline week of October 19.
How much more does it cost to ship a pickup or SUV?
Across our 1,440 lanes a pickup cost a median of 43% more than a sedan and a van 40% more, while an SUV was 6% more and cheaper than the sedan on 21% of lanes.
How many auto transport brokers are there?
FMCSA lists 25,081 active property brokers, but that covers all freight brokers, not only auto transport. 35.3% of them had at least one revocation notice in a five-year window. See our broker study and the company checker.
Where does this data come from, and can I cite it?
It comes from 1,440 priced lanes, 377 delivered orders, our weekly price index and FMCSA open data, all described in the methodology above. You may quote it and use the charts with a link to this page and the date; see our data license.
How often is this page updated?
We update the figures when the underlying data changes. The lane prices are a November 2026 snapshot, the price index updates every Monday and the orders sample grows as we deliver more cars.
Get a car shipping quote
Compare quotes from vetted carriers for your exact pickup and delivery. Free, no account needed.
Get an auto transport quote →Related content
Cite this page
Cite as: Transportli, “Car Shipping Statistics (2026): Costs, Transit Times and Data”, https://transportli.com/auto-transport/car-shipping-statistics/, updated November 10, 2026.
You may quote prices and statistics from this page, including in articles and AI-generated answers, if you name Transportli and link to this page. Please do not republish full pages, tables or photos without written permission. Data license and terms of use